The first concept to understand if you want to become a trader
11 December 2022
Aphorisms and quotes
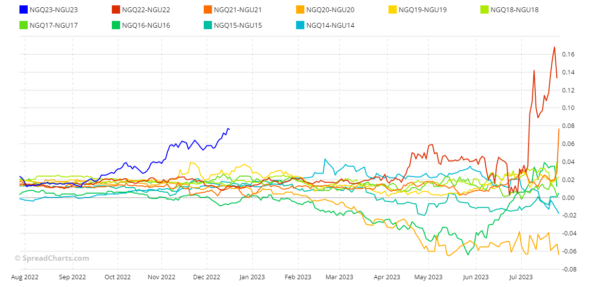
4 January 2023Natural gas has been the protagonist of 2022 with a sharp rise in price following the outbreak of war in Ukraine. Even though the price is now far from the highs reached in August, the NGQ23-NGU23 spread is close to its 32-year high, as the Continuous histogram chart shows.
Not only that. Always in the last 32 years, in just four sessions the spread has closed at a higher price than now. That the price of the spread is high is also evident from the Seasonality stacked chart.
Another interesting aspect is provided by the term structure in backwardation and with the 5- and 15-year averages having the two futures with the same price and close to a return in contango.
The spread also has a bearish seasonality that runs from January to April even though, those who do spread trading or simply work with commodities know full well, a seasonality has little value when set against particular endogenous factors, such as a war.
Always bearing in mind that a more or less severe winter makes a big difference to the price of natural gas, the spread is certainly interesting and worth monitoring. However, it is never easy to identify the level at which to open the operation in circumstances like these. The mistake of anticipating a trade too much and finding oneself in trouble is very common.
I once read a very useful piece of advice, “better to take a small part of a long trend than a big part of a short trend.” It was an invitation not to try to buy on the lows and sell on the highs, especially in situations like that of the NGQ23-NGU23 spread.
Natural gas has been the protagonist of 2022 with a sharp rise in price following the outbreak of war in Ukraine. Even though the price is now far from the highs reached in August, the
I am a macroeconomic and financial analyst with over 30 years’ experience, including two years as a fund manager. I specialise in currencies and commodities, and I am the author of several successful books on trading, macroeconomics, and financial markets.


