

How to predict the change in the interest rate
27 May 2021
One of my favourite spreads
21 June 2021
I take my cue from an email I received a few days ago from a trader who noticed strong movements on some commodities, usually very quiet, just before delivery. She asked me to explain the reasons for those sudden price accelerations.
Let us proceed step by step. First of all, it must be said that the futures of the commodities have three very important dates, which I report below:
- FPD, First Position Day, is the first day on which an investor who is short on a commodity futures contract can notify the clearing corporation of their intention to deliver the commodity. It is the last day on which traders can trade, as we then have to close all our positions with that contract (otherwise a broker will do it for us, and this is not recommended).
- FND, First Notice Day, is the first day on which a clearinghouse may inform an investor that it intends to carry out the delivery of a commodity that the investor previously bought in a futures contract.
- LTD, Last Trading Day, is the final day that a futures contract may trade or be closed out before the delivery of the underlying asset or cash settlement must occur.
These are dates that a commodities trader should always keep in mind.
In her email, the trader brings me as an example an old spread from a few years ago but that does not change the substance. The chart is that of CTZ16-CTZ17 and you can see it below.

From the chart, you can clearly see that after about a year in which the spread moved within a range, in mid-November it made a strong bullish move. Before explaining the reason, which is common to many commodities anyway, I want to show you two charts. These reproduce the cotton term structure on 14 and 15 November 2016.


Already the two curves compared are very explanatory but I want to bring back some data to give a complete picture. On November 15, the December delivery contract rose 2.6%, the March delivery contract rose 1.7%. Compared to the day before, the open interest of the December delivery contract on November 15 fell by 25% (from 43.077 contracts to 32.338 contracts) while volumes increased by 17.9% (from 17.188 contracts to 20.264 contracts). The March delivery contract saw both open interest (up 2.67%) and volume (up 67.73%, +11.800 contracts) rise on the same day.
Open interest had already been declining for a few days in the contract with delivery in December and this is because the Non-Commercial don’t wait until the last day to close contracts and move to the next delivery (March) but already start a couple of weeks (at least) earlier. Thus, as open interest declines, the market becomes increasingly volatile and a positive or negative movement can be amplified by speculation (the higher volume on day 15 on the December delivery contract demonstrates this).
Before the conclusions, let me show you two more charts always of the cotton term structure and related to the days 16 and 17 November.

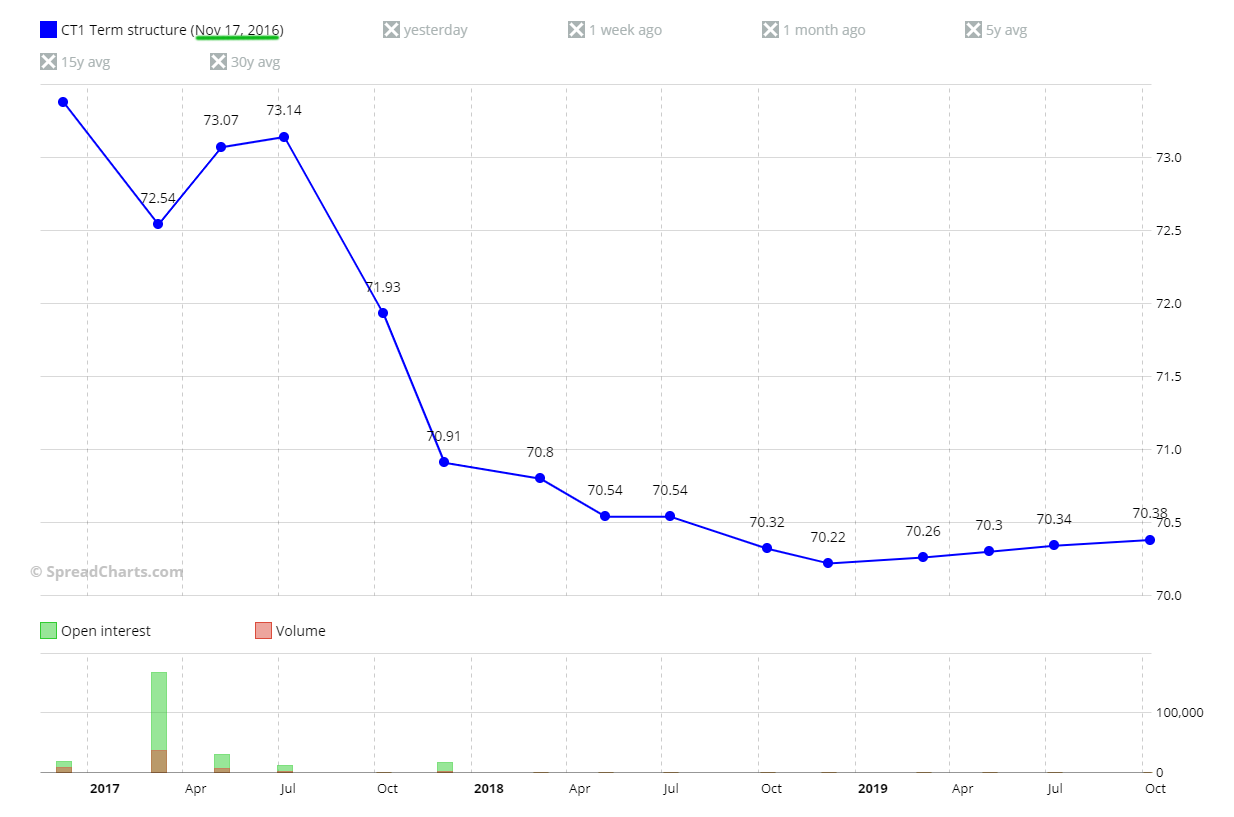
You can see how in just three days the curve has completely changed shape.
The open interest of the contract with delivery in December continued to fall as more positions were closed by Non-Commercial (-8.716 contracts on 16 November, -4.821 on 17 November).
So, in conclusion, the reason that some futures and calendar spreads show strong movements in the last trading days is simply due to increased and growing volatility (and sometimes speculation) as Non-Commercial (or Large Traders) move to the next delivery (in this case March).
There are traders who see in these strong movements opportunities, I see only a strong increase in risk, with futures less and less liquid. For this reason, I do not recommend to trade in the two to three weeks before the FND as you risk being overwhelmed by speculation, even using spread trading.

I take my cue from an email I received a few days ago from a trader who noticed strong movements on some commodities, usually very quiet, just before delivery. She asked me to explain the reasons for
I am a macroeconomic and financial analyst with over 30 years’ experience, including two years as a fund manager. I specialise in currencies and commodities, and I am the author of several successful books on trading, macroeconomics, and financial markets.


