
Macroeconomic data & events of the week
1 May 2022
Eur-Gbp and some important considerations
14 May 2022
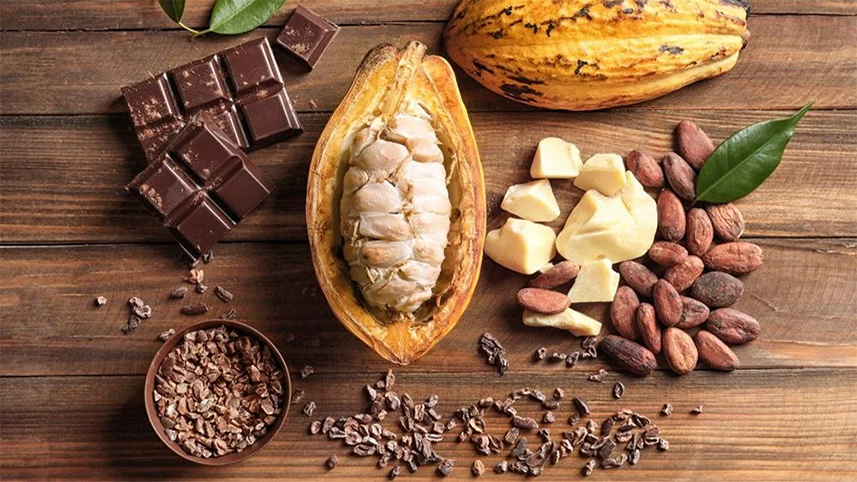
Soybean oil is one of the commodities most affected by the war in Ukraine. I have explained why in other analyses. Ukraine and Russia account for 80% of sunflower oil exports, which, with the closure of Ukraine's exports and imports from Russia, have been lost. Sunflower oil accounts for 15% of total natural oils. This has resulted in countries shifting to other natural oils, mainly soybean oil and palm oil (with the latter also experiencing problems).
All this has led to an increase in demand for soybean oil and, consequently, a sharp rise in price. Trading soybean oil has been very difficult in recent months. Almost all seasonality were not respected, and the only trades that have brought any gains have been a few days of hit-and-run operations that are not in my modus operandi anyway.
The best way to trade soybean oil is undoubtedly through multi-leg spreads, that is, with more than two legs. In this way, you no longer work on prices but on the term structure which can change independently of the trend of the underlying.
In this brief analysis, I show you a Butterfly on soybean oil, more precisely the spread ZLZ22-2*ZLN23+ZLV23. The spread is to be sold and I begin by showing you the spread together with the seasonal patterns.

I should point out that unfortunately the 15-year seasonal pattern only starts in July (the 30-year pattern starts in August). The seasonality is bearish. In particular, June is a bearish month as the next chart shows.
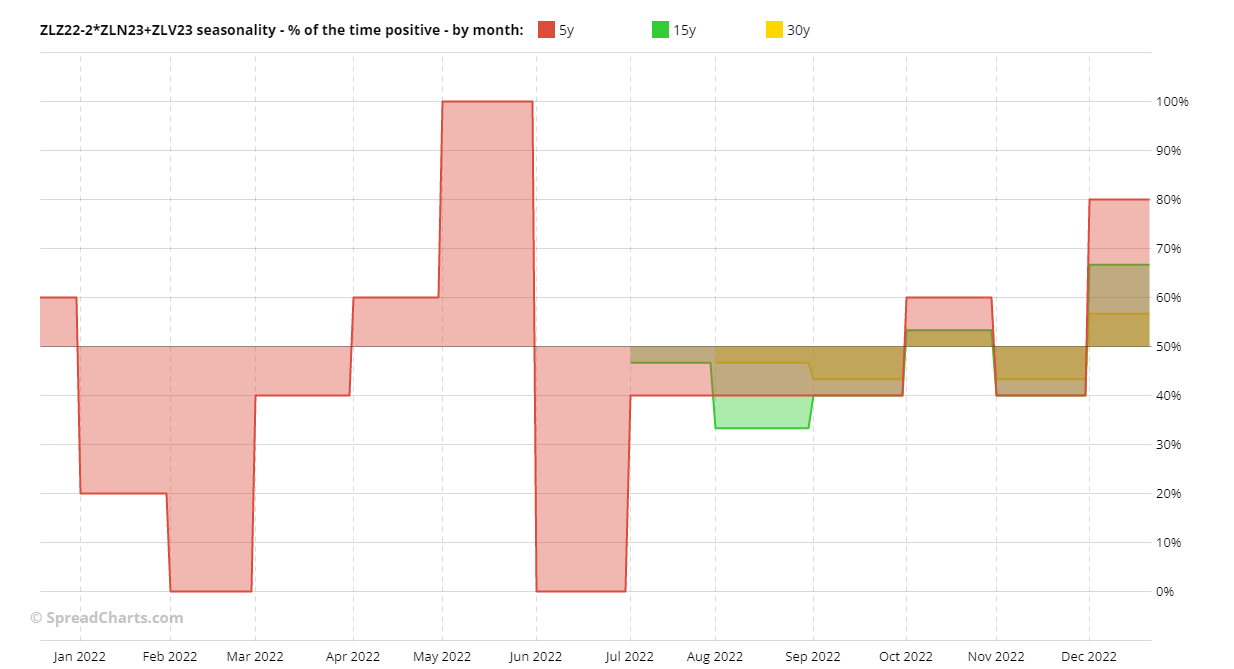
In fact, while May over the past 5 years has always seen the spread go up, June has always seen the opposite, with 5 out of 5 years being bearish.
As mentioned, the spread exploits anomalies in the term structure, so I am not interested in whether the price of soybean oil goes up or down in the coming weeks, but in how the term structure evolves. However, I do find one aspect interesting. I show it to you with the Seasonality stacked chart.

The interesting aspect of this chart is the strong correlation between this year and 2021, the only one with a higher price than the current one. If this correlation continues in the coming weeks, this would certainly be a great advantage for those who sold the spread.
The last chart I show you is the term structure.
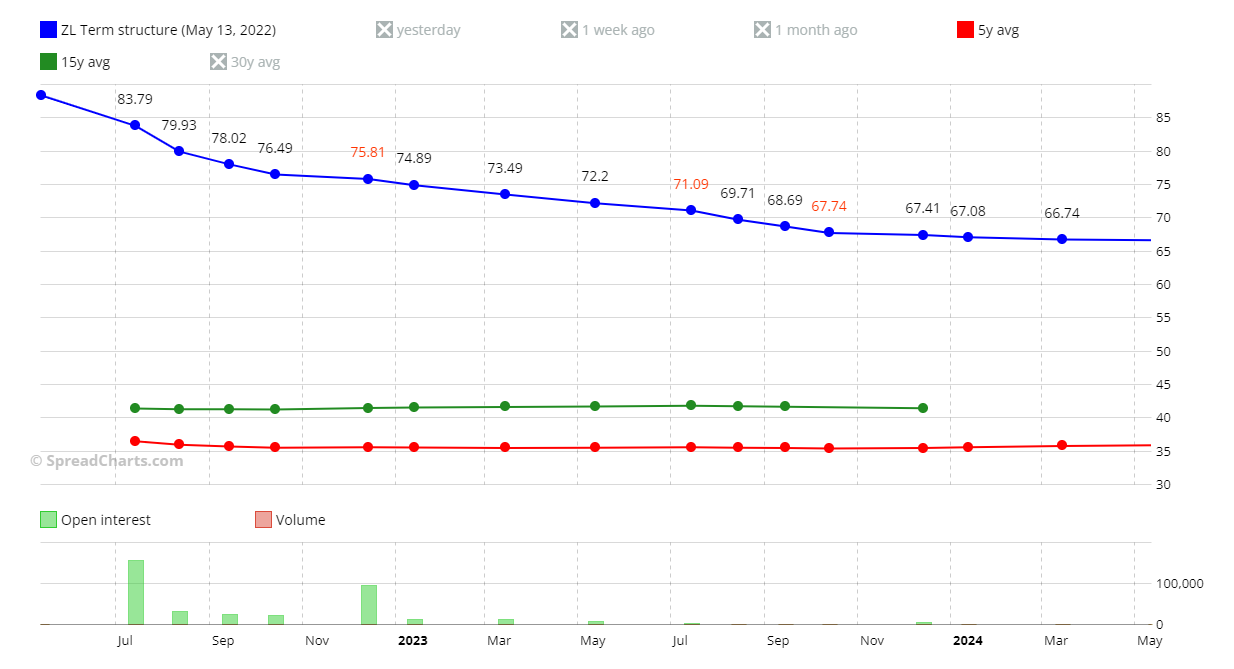
Even though very crushed, you can see how both the 5-year average and the 15-year average are much flatter (and in slight contango) than the current term structure. The aim of the trade is precisely to take advantage of a contango return of the term structure.
Although not exceptional, the open interest of even the October 2023 delivery is above 1,000 contracts.
Before closing, a foretaste. This will be the last analysis that I post on the site. The reasons for my choice I will explain in the next article.

Soybean oil is one of the commodities most affected by the war in Ukraine. I have explained why in other analyses. Ukraine and Russia account for 80% of sunflower oil exports, which, with the closure of